This case study describes a PE-backed $31M ARR SaaS company that reconciled $4.8M in phantom pipeline, reduced forecast variance from 31% to 11%, and passed add-on acquisition diligence without material adjustments. The scenario is a modeled composite, not an MxM client engagement. Figures are modeled outcomes.
The short answer: A structured pipeline audit reclassified $4.8M of $8.3M stated pipeline as phantom, forecast variance moved from 31% to 11% over two quarters, and average discount at close moved from 19% to 11% once stage-exit evidence and a CRM discount block were in place. The mechanism is not behavioral. Reps used the system they had. Installing evidence requirements at each stage changed the operating record without correcting individuals.
Canonical definition
Phantom pipeline
Phantom pipeline is the portion of stated CRM pipeline that would not survive a structured evidence audit against three tests: recent buyer activity (documented engagement inside 30 days), stage-exit artifacts (each active stage substantiated by the evidence it was designed to require), and no duplicate records (one canonical opportunity per active buying process). Any deal that fails all three tests is dead and should be archived. A deal that fails one is either stale and requires re-engagement or has been stage-jumped without evidence.
The Situation
Fourteen months after acquisition, the PE operating partner flagged the portfolio company's pipeline data as unreliable in the quarterly operating review. The CRM showed $8.3M in active pipeline. Finance could not reconcile two consecutive quarters of CRM-to-collections gaps exceeding 25%. An add-on acquisition was approaching diligence in 90 days and the pipeline data could not be used as presented.
The company had grown from $18M to $31M ARR in the 14 months post-close, primarily through a mid-market expansion. The CRM had not scaled with the team. Stage management was informal, activity logging was inconsistent, and no reconciliation process had been run since the acquisition.
What the Audit Found
A full pipeline audit preceded the controls installation. Three failure categories accounted for most of the gap between the CRM number and the credible pipeline figure.
Zombie pipeline
62% of deals classified as Stage 3 or higher had no logged activity in the prior 60 days. These deals were neither closed nor lost. They had simply stopped moving, but no one had reviewed them, downstaged them, or marked them lost in the CRM. They continued appearing in the pipeline and the forecast without any active buyer engagement behind them.
Stage-jumping without evidence
31% of Stage 4 deals had no verifiable documentation of Stage 2 or Stage 3 completion. Deals had been advanced directly to Stage 4 based on rep judgment. In several cases, deals in the final pipeline stage had no record of a legal contact or a mutual action plan. They carried the highest commit weight in the forecast with none of the evidence that stage was designed to require.
Discount bleed without controls
The company had a published discount policy capping field discounts at 8%. The average discount at close was 19%. No exception log existed. Discounts above 8% nominally required VP approval, but the requirement had no CRM enforcement. Reps were closing deals at 15% to 22% discount and marking them as standard closes. Finance billed the discounted amount with no visibility into the variance from list price.
The Intervention
A four-component engagement ran over eight weeks.
Pipeline classification audit
Every open opportunity was reviewed against three categories: Active (buyer engaged in the last 30 days with a documented next step), Stale (no activity in 30 to 90 days, requiring immediate re-engagement), or Dead (no activity in 90 or more days, or explicit buyer disengagement). Dead deals were archived rather than deleted to preserve the audit trail. Active pipeline fell from $8.3M to $3.5M qualified.
Stage-exit controls installed
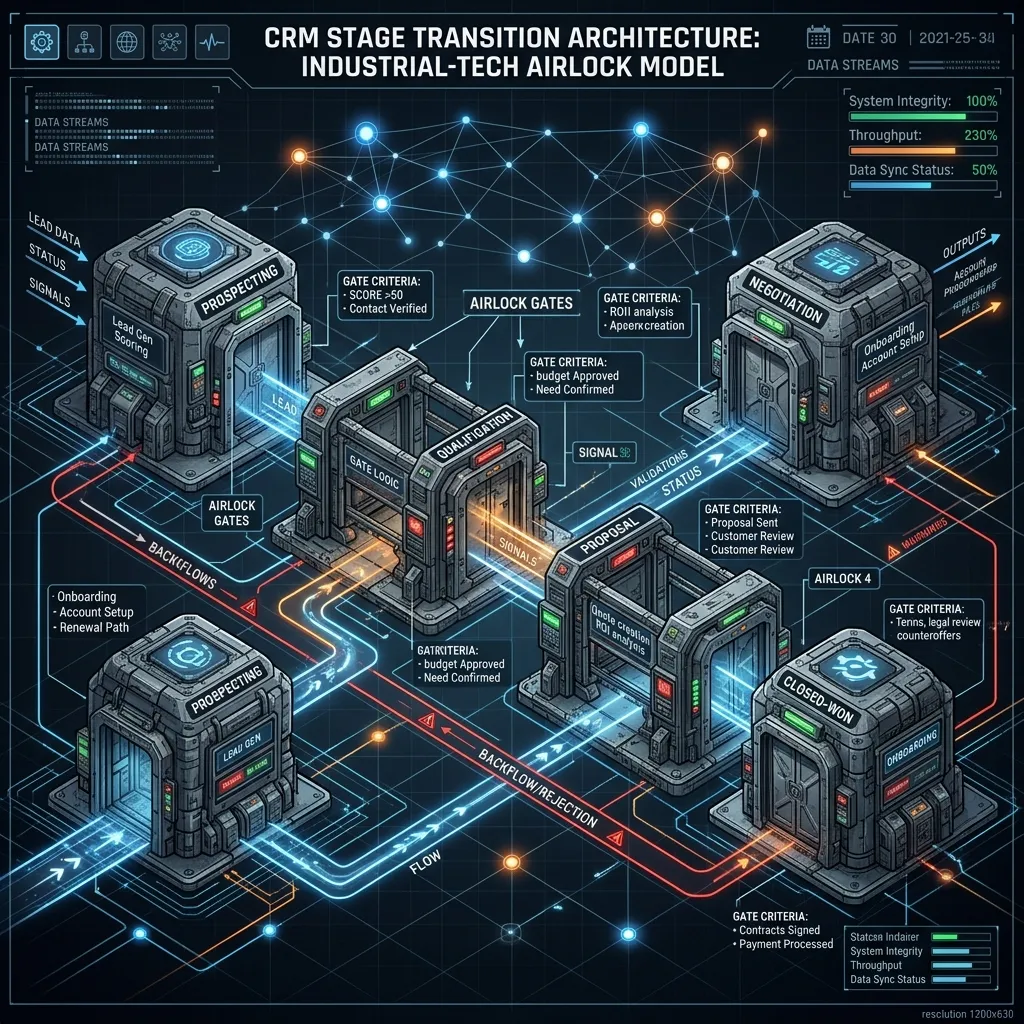
Each stage received binary validation rules built into the CRM stage-change workflow. Stage 2 required a named economic buyer and a documented pain statement. Stage 3 required a mutual action plan and a legal contact. Stage 4 required written buyer acknowledgment of deal terms and a finance introduction. Deals could not advance without the artifacts. Retroactive stage-jumping became structurally impossible.
Discount approval workflow enforced
The 8% discount ceiling was built into the CRM as a hard block. Discounts above 8% required VP approval through a CRM approval workflow before the deal could advance to Stage 4. An exception log captured every request with the reason, approver, and outcome. The informal practice of closing above policy without documentation was closed off at the system level.
Monthly pipeline health report to PE operating partner
A standard report was delivered to the PE operating partner on the first business day of each month. It included active pipeline by stage, deals moved in the prior month with evidence status, the discount exception log, and a comparison of the current forecast to the prior month's close. The operating partner could monitor pipeline quality without waiting for quarterly reviews.
Results
| Metric | Pre-Engagement | Q1 Post-Controls | Q2 Post-Controls |
|---|---|---|---|
| Active Pipeline (Qualified) | $3.5M of $8.3M stated | $3.5M | $4.1M |
| Quarterly Forecast Variance | 31% | 18% | 11% |
| Average Discount at Close | 19% | 14% | 11% |
| Add-On Diligence Adjustments | Not assessed | None required | N/A |
The add-on acquisition diligence ran 11 weeks after the pipeline audit completed. The portfolio company's pipeline was submitted as part of the data room. The diligence team accepted the pipeline without material adjustment and without requesting a reconciliation session. The deal closed on the original timeline.
To pressure-test what a $4.8M phantom-pipeline reclassification and a 20-point variance move are worth against your own ARR base, model the revenue at risk before scoping the controls install for diligence prep.
Why Does PE Diligence Focus on Pipeline Reliability?
Pipeline reliability is a value-creation input, not a hygiene concern. Bain and Company's 65-deal analysis of PE transactions found that 71% of deals underperformed their projected margins by an average of 330 basis points (Bain, integrating due diligence to build lasting value). Overstated pipeline is one of the mechanisms behind that underperformance: a plan built on inflated coverage produces a hiring, spending, and revenue-recognition schedule that is not supported by the actual buying activity underneath.
The comparable pricing environment reinforces the same message. Public cloud comparables trade at a median 6.1x forward revenue on the Bessemer Cloud Index, and the Software Equity Group 2025 SaaS Report links a Net Revenue Retention (NRR) at or above 120% to the strongest revenue multiples at exit (SEG 2025). Pipeline that cannot be reconciled to source records is not a Net Revenue Retention problem, but it is priced as an operating-quality problem in the same conversation.
Generative AI does not change the discipline. Bain finds the median revenue and cost benefit from scaled generative AI is a 12% improvement, up from a prior 5% baseline (Bain, 12 is the new 5, 2024). A PE operating partner reading that number expects to see the impact in the forecast bridge, tied to named motions and cohorts, not layered on top of a phantom pipeline.
Why PE Portfolios Face This Problem
The pattern in this case is common in post-acquisition SaaS portfolios. A company grows through the acquisition period, headcount scales, deal volume increases, and the informal stage management that worked at $10M ARR is overwhelmed at $30M. No single point of failure causes the problem. Accumulated operating friction across dozens of reps and hundreds of deals produces a CRM that reflects optimism more than operating state.
The fix is structural, not behavioral. Reps in this case were not gaming the system. They were using the system they had. The system did not require evidence to advance deals, so they advanced without evidence. Installing the evidence requirement changed the behavior without requiring anyone to be individually corrected.
PE and Growth Governance
Pipeline diligence preparation for PE-backed B2B SaaS
The Revenue Integrity Scorecard maps pipeline quality against four control layers and identifies where the data cannot defend itself in diligence. Completed in one session, returned within two weeks.
Request the Scorecard →