CRM and Bank Statements Answer Different Questions
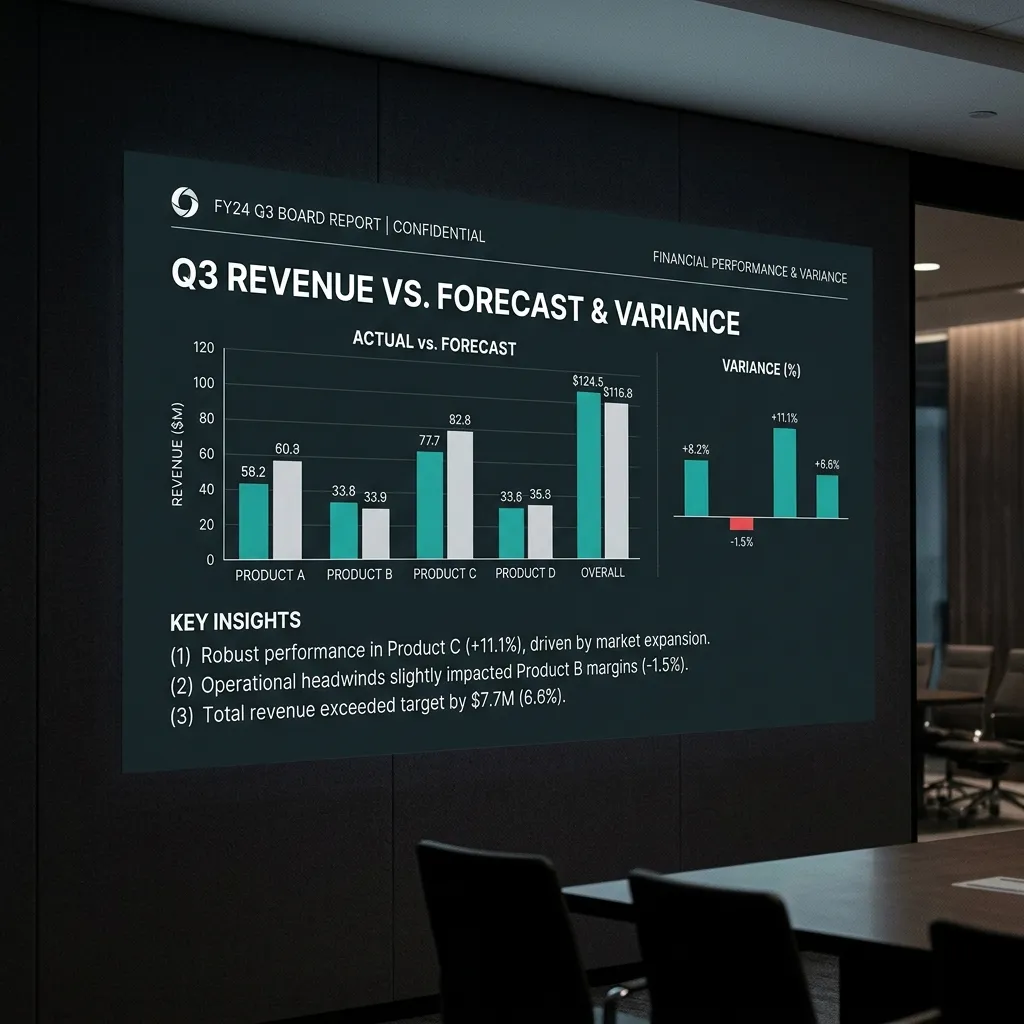
A CRM report tells you what the team believes it has sold, what should close, and what should convert into revenue. The bank tells you what actually arrived in cash. Neither view is wrong. They are just answering different questions. Reconciliation is the work of proving how one becomes the other.
That distinction matters because many forecast misses are not pipeline-generation problems. They are conversion-to-cash problems. A deal marked closed-won in CRM may still be unsigned, delayed in implementation, discounted below forecast, credited after invoicing, or collected later than Finance assumed. If those steps are invisible, the board sees one number in CRM and a different one in the cash report, and leadership ends up explaining the gap after the fact. That gap between bookings and collected cash is the operating definition of revenue leakage.
What CRM-to-Bank Reconciliation Actually Means
A useful reconciliation review does not ask whether the dashboard looks clean. It asks whether the same deal can be followed across the operating records that matter. At minimum, that means comparing:
- Opportunity record: expected deal value, close date, owner, and segment.
- Contract record: signed date, commercial terms, billing trigger, and start date.
- Invoice record: invoiced amount, invoice date, credits, and payment terms.
- Cash record: collected amount and receipt date.
CRM-to-Bank Reconciliation Simulator
Estimate how much booked CRM value survives into contract-backed, invoiced, and forecast-period cash.
Total value of opportunities marked Closed-Won in your CRM for the forecast period.
Share of Closed-Won deals with no signed contract, order, or purchase evidence on file.
Average days between contract signature and billing start. Delays reduce in-period invoicing.
Invoice value lost to post-invoice credits, pricing adjustments, or billing disputes.
Average days from invoice to cash receipt. Values above 30 apply a directional collection-lag haircut.
This simulator uses simplified assumptions to show directional forecast leakage. It is not accounting advice and does not replace reconciliation of CRM, contract, billing, and bank data.
Want to test this against your actual revenue data?
Reconcile CRM, contract, invoice, and cash evidence in a Revenue Integrity Scorecard.
If those records do not line up, the forecast is carrying assumptions that have not been validated yet. That is a control issue, not a formatting issue.
Which Systems Are Involved
The reconciliation breaks down across three distinct system layers, and each layer holds different fields. Understanding where each field lives is what makes the comparison useful.
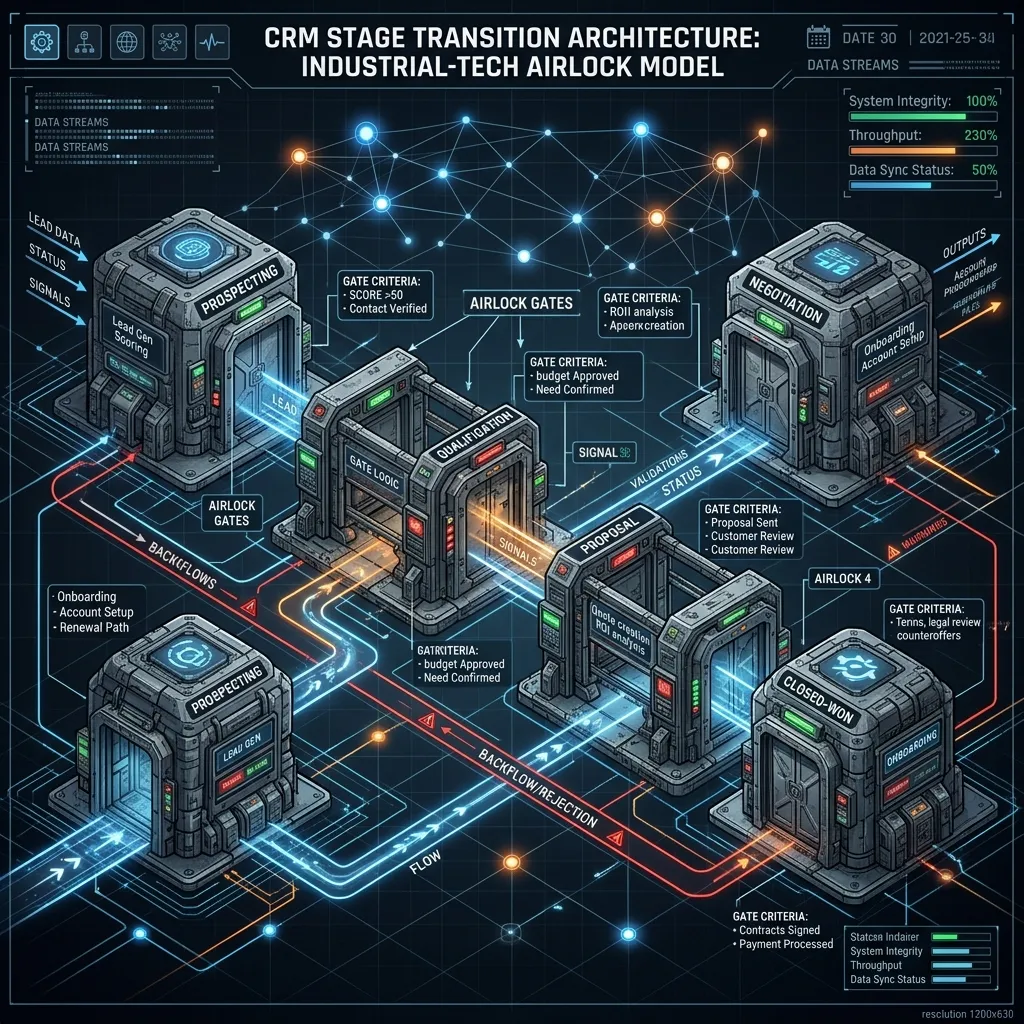
CRM layer (Salesforce, HubSpot). This is where the deal was created and tracked. The fields that matter for reconciliation are: opportunity close date, deal value at time of close, owner, segment, and stage history. Salesforce stores this in the Opportunity object; HubSpot stores it in the Deal record. The CRM is the upstream source. Everything downstream is supposed to match it.
Billing layer (Stripe Billing, Chargebee, Zuora). This is where the contract terms get converted into invoices. The fields that matter are: subscription start date, invoiced amount, billing frequency, discounts applied, credits issued, and payment status. Stripe Billing captures these at the subscription and invoice level. Chargebee and Zuora add more contract complexity, including amendment tracking and billing triggers tied to implementation milestones. The billing layer is where commercial drift first becomes visible. A discount applied here that was not in the CRM opportunity is a reconciliation gap, even if neither system flags it.
Finance and ERP layer (NetSuite, QuickBooks, Xero). This is where collected cash is recorded. The fields that matter are: payment receipt date, collected amount, applied credits, write-offs, and the general ledger account the receipt hits. NetSuite handles multi-entity consolidation and ASC 606 revenue schedules. QuickBooks and Xero are more common at lower ARR and are typically reconciled through bank feeds.
The comparison breaks down between layers for three reasons. The CRM close date does not match the billing start date. The invoiced amount does not match the opportunity value. The cash receipt does not match the invoice amount. Any one of those gaps, unresolved across enough deals, produces the unexplained variance that ends the board meeting badly.
ASC 606 and Why Reconciliation Is a Compliance Question
Most teams treat CRM-to-bank reconciliation as an operational hygiene task. It is also a compliance requirement for any company that will face external audit or diligence.
ASC 606, the FASB revenue recognition standard, requires revenue to be recognized when control of a promised good or service transfers to the customer, specifically when performance obligations are satisfied. That standard does not care what the CRM says. A deal marked closed-won in Salesforce on the last day of the quarter does not produce recognized revenue until the corresponding obligation is fulfilled, the contract is signed, and billing can begin.
The practical consequence: a company that has not reconciled CRM to billing to cash cannot produce a clean revenue recognition schedule. If the gap between what the CRM shows as closed-won and what Finance has actually invoiced and collected is large, the revenue figures in the financial statements are carrying assumptions that have not been validated against the operating record.
For companies preparing for a Series B, a PE process, or an acquisition, auditors and diligence teams will pull exactly these records. OpenView Partners SaaS Benchmarks (openviewpartners.com) consistently show that reconciliation gaps are a leading indicator of revenue recognition risk in diligence. Companies that cannot produce a clean pipeline-to-cash trace face prolonged diligence timelines and, in some cases, restatement risk. CRM-to-bank reconciliation is not extra work. It is the operating process that makes ASC 606 compliance an artifact of normal cadence rather than a fire drill before close.
The Three Breaks That Usually Create the Gap
Once you compare the records, the same failure modes appear repeatedly.
- Commercial commitment is weaker than the CRM stage suggests. The opportunity is marked won, but signature, procurement, or legal completion is still outstanding. Salesforce shows the deal as closed. DocuSign shows no completed contract. Billing cannot start. The CRM booking is real in intent; it is not real in operating terms.
- Billing starts later than the forecast assumed. The contract is real, but service start, onboarding, or activation conditions delay invoicing beyond the quarter plan. Chargebee or Zuora will show a subscription created date that is weeks after the CRM close date. Finance is planning against a billing date that has already slipped.
- The final value drifts. Discounts, credits, partial billing, or collections friction reduce the amount that actually reaches the invoice or the bank. The opportunity in HubSpot shows $120K. The Stripe invoice shows $108K after a discount applied during contract negotiation. The cash receipt in QuickBooks shows $90K collected across two partial payments. Three different numbers for the same deal, none of them flagged as an error by any system.
None of this is exotic. It is normal operating friction. The problem starts when the company has no shared review that forces those differences into the forecast early enough to matter.
How to Run the First Reconciliation Pass
A practical first pass is cohort-based. Pull recently closed deals and renewals for the last one or two quarters and compare the key fields line by line. The goal is not to create a perfect data warehouse model on day one. The goal is to locate which assumptions break most often.
- Pull closed-won deals and renewals for the cohort period from your CRM (Salesforce or HubSpot). Collect the opportunity close date, expected deal value, owner, and segment for each deal.
- Match each opportunity to its contract record. Collect the signed date, commercial terms, billing trigger, and billing start date. If no contract record exists for a closed-won deal, that is the first control failure.
- Match each contract to its invoice in Stripe Billing, Chargebee, or Zuora. Collect the invoiced amount, invoice date, any credits applied, and payment terms.
- Match each invoice to its cash receipt in NetSuite, QuickBooks, or Xero. Collect the collected amount and the date payment arrived.
- For each deal where adjacent records do not match, record the gap and assign a cause code: billing delay, discount leakage, credit or write-off, or attribution error.
That review usually tells you whether the business is overstating deal certainty, overstating billing timing, or understating downstream commercial changes. Those are different problems and need different controls.
The Five-Step Reconciliation Table
The table below maps each step in the reconciliation to the record type, the fields that matter, the systems that hold them, and the failure mode that breaks the chain.
| Step | Record Type | Key Fields | System Examples | Common Failure Mode |
|---|---|---|---|---|
| 1 | CRM Opportunity | Close date, deal value, owner, stage | Salesforce, HubSpot | Unsigned deals marked won; premature stage advancement |
| 2 | Contract | Signed date, billing trigger, start date, commercial terms | DocuSign, contract system | Billing start delayed; contract terms differ from CRM opportunity value |
| 3 | Invoice | Invoice date, invoiced amount, credits applied, payment terms | Stripe Billing, Chargebee, Zuora | Discounts applied post-close; partial billing; credits reduce recognized amount |
| 4 | Cash Receipt | Collected amount, receipt date | NetSuite, QuickBooks, Xero, bank feed | Collection lag; partial payments; write-offs not reflected in CRM |
| 5 | Gap Attribution | Cause code per deal | Spreadsheet or reconciliation tool | No standard cause codes produce no pattern visibility and no control fix |
The final step is the one most companies skip. Without a cause code on every gap, the reconciliation produces a list of differences but no diagnosis. You can see that steps 2 and 3 do not match for 14 deals, but you cannot tell whether the problem is systematic (billing process) or deal-specific (negotiation exception). Cause codes convert a reconciliation into a control diagnostic.
Why CSV Exports Are Usually Enough
Most teams assume reconciliation requires a large integration project. It usually does not. A first diagnostic can often be done with CRM, contract, billing, and collections exports. In fact, flat exports are often useful because they show what the business is actually operating from, not the cleaned-up version a reporting layer presents later.
Improving CRM data hygiene can increase forecast accuracy by up to 30% (Gartner). That improvement does not require a new system. It requires a consistent review that catches mismatches before they accumulate.
The point is not to avoid systems work forever. The point is to prove where the number breaks before expanding scope. If the same closed-won cohort shows systematic lag between CRM close date and invoice date, the control issue is already visible in four CSV files.
How MxM Revenue Engineering Solves This
MxM Revenue Engineering performs CRM-to-bank reconciliation as a structured service engagement for B2B SaaS companies between $2M and $20M ARR. The engagement does not start with a system integration. It starts with a Scorecard: a structured diagnostic that compares the operating records across CRM, contract, billing, and cash and surfaces the control failures driving the gap. The Scorecard identifies at least 5 critical control failures, or the client can cancel within 10 days. Methodology claim.
In the HP/HPE engagement, data quality improved from 65% to 91% in one engagement (observed outcome, HP/HPE engagement). Forecast variance improved from plus or minus 28% to plus or minus 5% in the same engagement (observed outcome, HP/HPE engagement). These results came from applying a structured reconciliation process to operating data that was already present in the system, just never compared across records in a single review. Structured forecasting processes achieve 15% higher accuracy than ad hoc approaches (Forrester 2024). The reconciliation is what makes a forecasting process structured. Without a confirmed link between CRM bookings and billing actuals, the forecast is structured in format only.
After the Scorecard, MxM installs the controls that prevent the same gaps from recurring. The Reconciliation Engine matches CRM bookings to billing and invoicing daily, not as a dashboard (methodology claim). A dashboard shows you the current state of each system in isolation. The Reconciliation Engine shows you where the same deal diverges between systems and flags it before the quarter closes. The Controls Install that follows defines stage exit criteria, billing trigger standards, and a reconciliation cadence that runs before every board cycle.
Request Your Scorecard
Find the control failures before the board does.
The Scorecard identifies at least 5 critical control failures in your CRM-to-cash chain, or you cancel within 10 days. No API access required for the first pass.
Book a Call →What Changes Once the Number Is Reconciled
Reconciliation does not make the business perfect. It makes the forecast more honest. Instead of arguing about whether CRM is wrong or Finance is too conservative, the company can point to the exact place where the conversion from pipeline to billing, or from invoice to cash, is failing. That shortens the operating conversation and makes ownership clearer. The board package stops being a document that different functions are secretly reconciling in parallel the night before.
Free Model
What is your forecast variance actually costing you?
Run the numbers: model your quarterly revenue at risk, the cost of inaction, and how fast the fix pays back, with stage-specific benchmarks for Series A to C.
Run the ROI Model →The Red List
This article maps to CRM-to-Cash Drift and Unsigned Closed-Won, two of the 20 failure modes MxM tests in every Scorecard.
View the Red List →